
Downtown Charleston SC Real Estate and Community Guide
Home prices, neighborhoods, schools, taxes, parks and the real trade-offs of living on the Charleston peninsula, built from closed MLS sales since January 2023.

What this guide covers
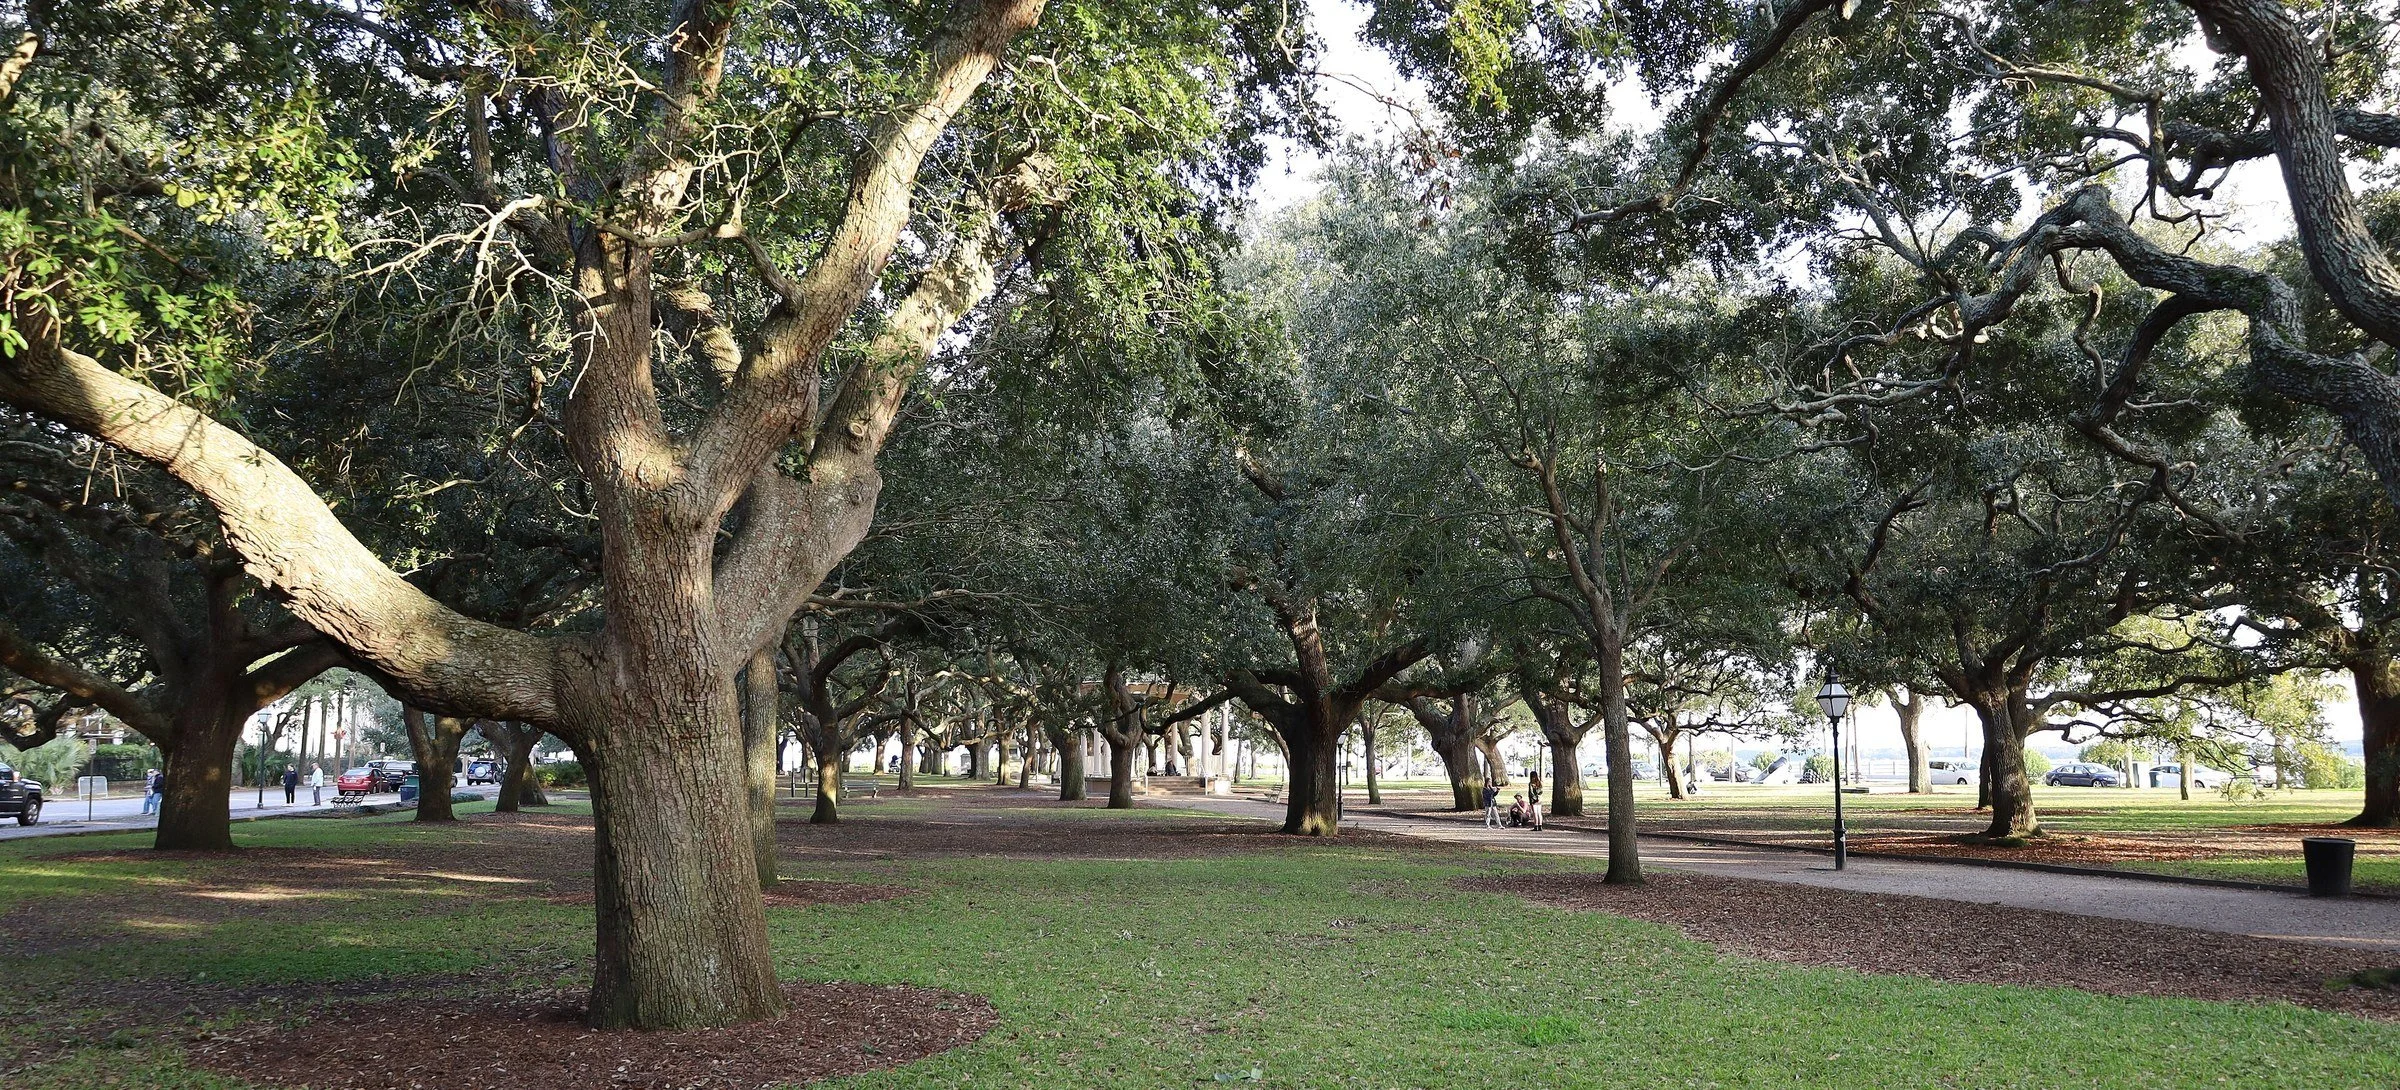
Downtown Charleston is the peninsula: the historic streets south of the Crosstown (Septima Clark Parkway / U.S. 17) and the Upper Peninsula neighborhoods that sit above it. You can walk to dinner, skip the bridges, and spend a Saturday at Hampton Park or along the water. The trade-off is price, older bones, smaller yards, and flooding you have to check street by street.
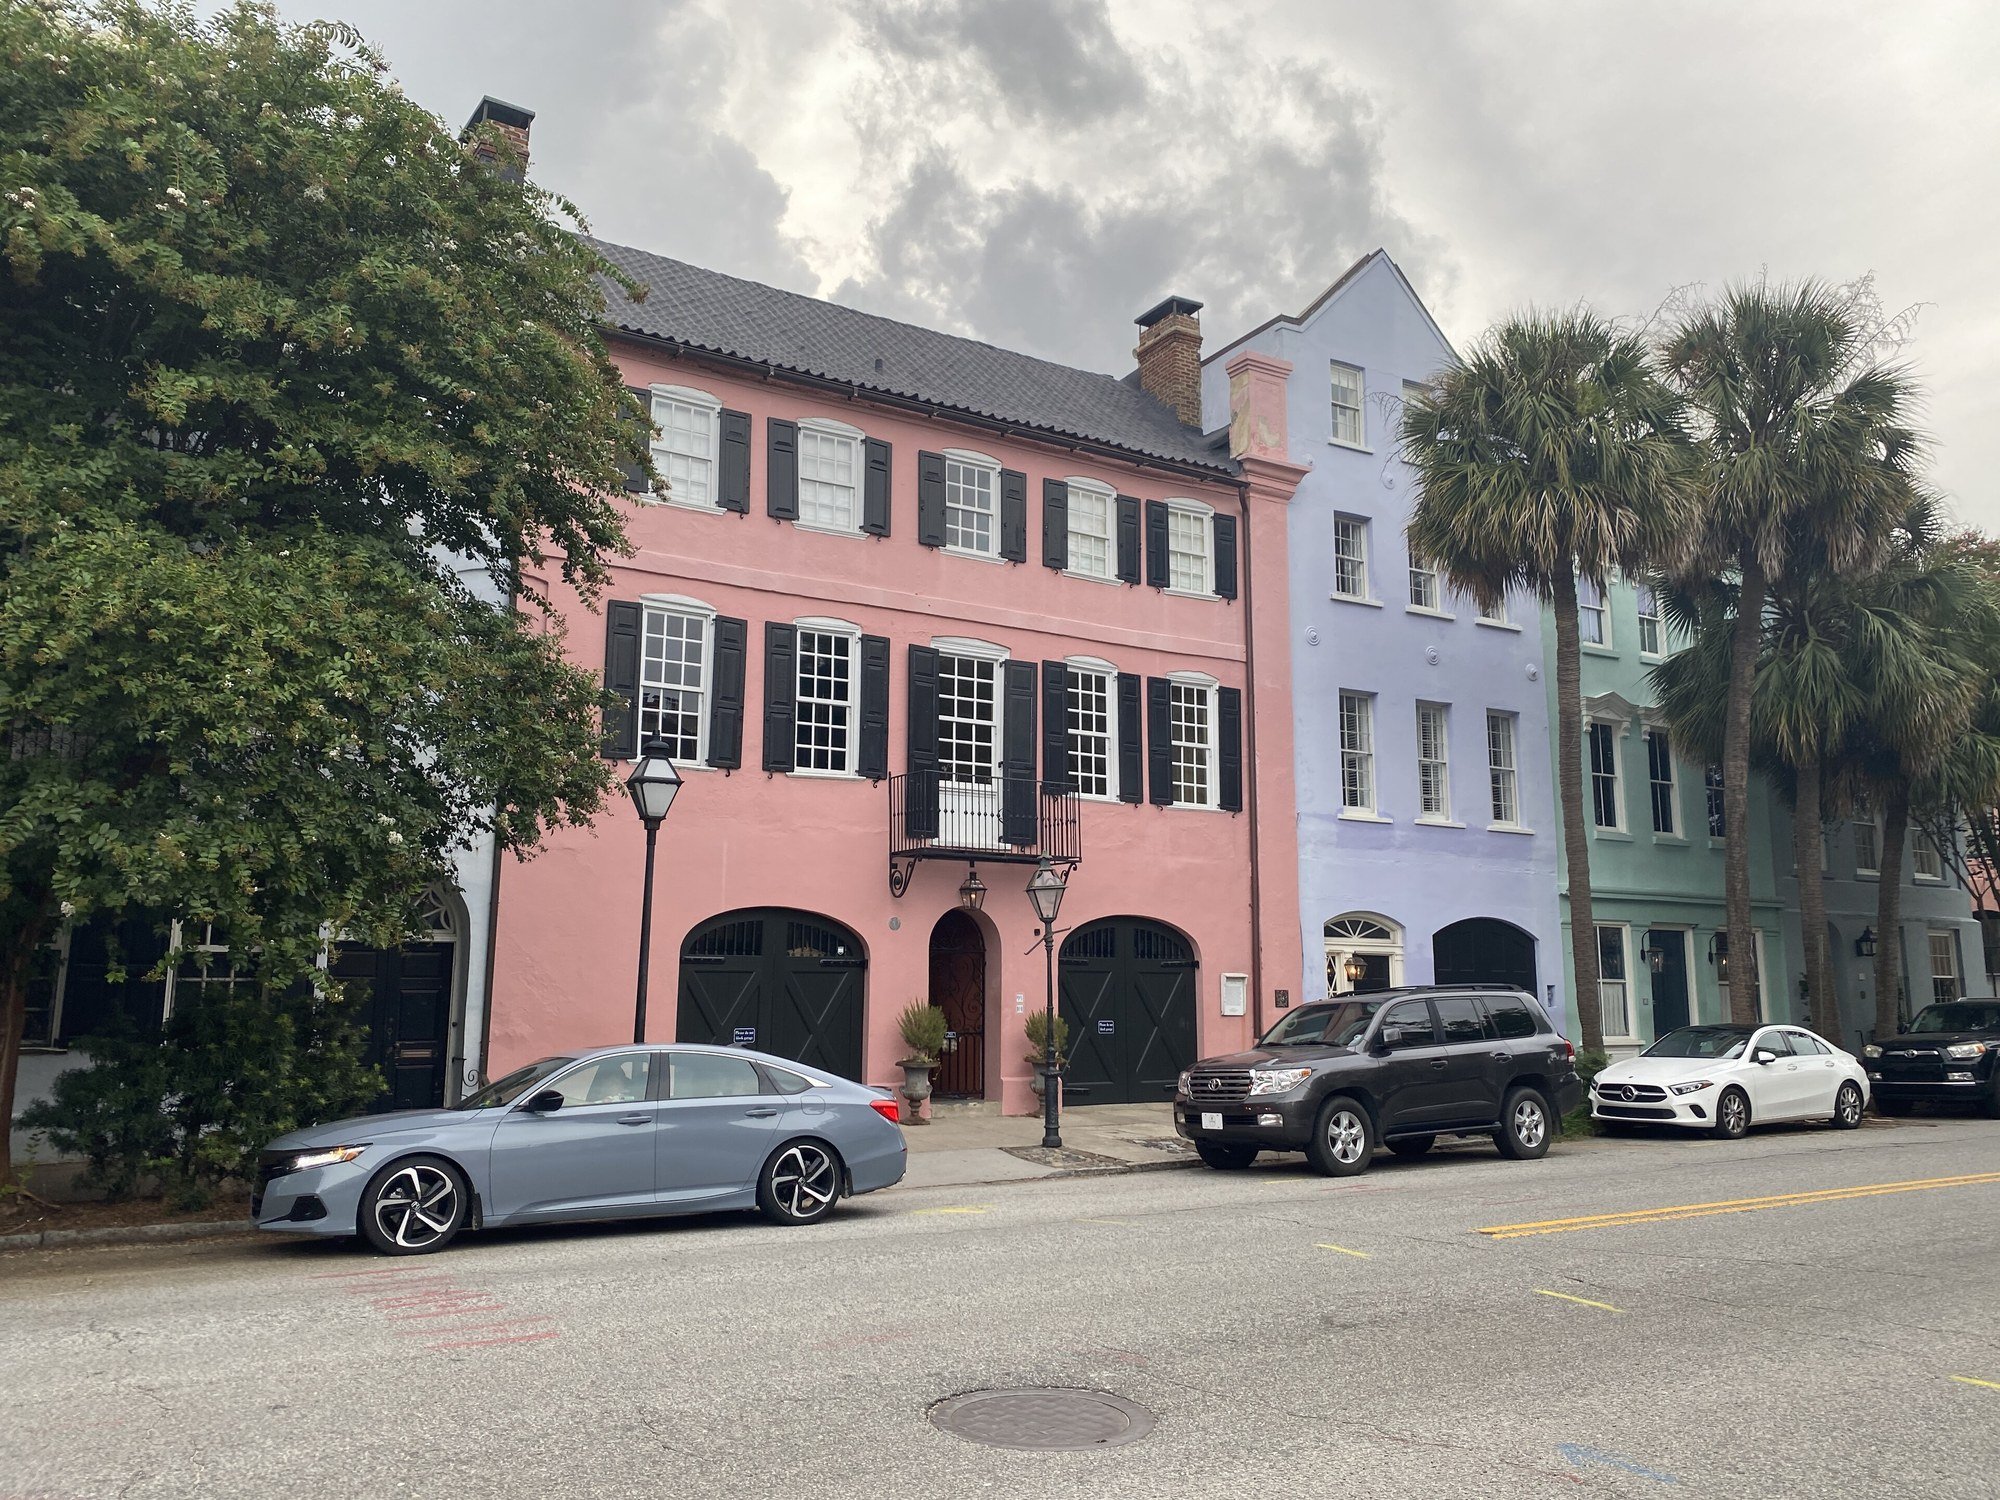
The Crosstown splits this into two very different markets. Below it, in MLS area 51, you get the historic lower peninsula: South of Broad, the French Quarter, Harleston Village, Ansonborough, Cannonborough-Elliotborough, Radcliffeborough and neighboring streets. Above it, in MLS area 52, you get the Upper Peninsula: Wagener Terrace, North Central, Hampton Park Terrace, the Westside and neighboring streets, with more of the mid-century bungalows I talked about in the video. I walked through that split in my video, and the sales back it up.
How we define Downtown Charleston here: every closed single-family detached and attached (townhome and condo) sale in the CHS Regional MLS in MLS area 51 (Peninsula Charleston Inside of Crosstown) and area 52 (Peninsula Charleston Outside of Crosstown), from January 1, 2023 to November 20, 2026. That's almost all of zip codes 29401 and 29403. It leaves out the rest of the City of Charleston, lots, land and manufactured homes. The grouping is mine, not an official MLS "Downtown" product. Some of area 52 sits toward the Neck, and not everyone would call every street there Downtown. I included both areas so you can see the split.
That comes to 2,160 closed sales since January 2023, ranging from $90,000 to $21,028,560, with a median of $1,020,000.
A note on medians: unless a line says "houses only," every median here covers all home types together (houses, townhomes and condos), and "2026 YTD" means January 1 to November 20, 2026. Townhomes and condos pull the all-types median down, so the houses-only number runs higher. The gap is especially wide below the Crosstown, where a handful of attached sales sit next to multi-million-dollar houses.
Headline stats
Jan. 1 to Nov. 20, 2026. Single-family detached and attached homes in MLS areas 51 and 52 (the Charleston peninsula). Source: CHS Regional MLS via Flexmls.
Key takeaways
Prices are up this year.
The all-types median was $1,048,673.50 in the same calendar window of 2025 (Jan. 1 to Nov. 20) and is $1,180,627.50 so far in 2026. Houses only: $1,280,000 in that 2025 window, $1,377,500 so far in 2026.
More homes are selling, and volume is up.
542 sales so far in 2026, up from 506 in the same window of 2025. Closed volume is already $1.029 billion this year, ahead of the $774 million in that 2025 window.
Homes take longer to sell than in 2023.
Median days on market went from 10 in 2023 to 22 in 2026 YTD. The share of homes selling over list price dropped from 16% to 10%.
The Crosstown is two different price points.
In 2026 YTD, houses inside the Crosstown (area 51) have a median of $2,363,000. Houses outside it (area 52) have a median of $994,990. Since 2023, South of Broad has a median of $2,822,500, and Wagener Terrace has a median of $942,500.
The top end is busier.
318 homes have sold for $1M or more so far in 2026, up from 185 in the same window of 2023. That's 59% of this year's sales.
Houses still move faster than townhomes, and the Upper Peninsula is tighter.
Detached homes are at about 3.4 months of supply with a median of 19 days on market. Attached homes are at about 4.9 months and 24 days. Houses outside the Crosstown are tighter still, at about 2.7 months and 12 days.
Downtown Charleston at a glance
| Location | The Charleston peninsula, Charleston County, SC. Historic streets south of the Crosstown and Upper Peninsula neighborhoods north of it |
| Local government | City of Charleston. Tax districts 71 (Downtown) and 72 (Neck Area) both apply on the peninsula; check the tax bill for the exact address |
| Zip codes | Almost all 29401 and 29403 |
| MLS areas | 51 (Peninsula Charleston Inside of Crosstown) and 52 (Peninsula Charleston Outside of Crosstown) |
| Median sale price, 2026 YTD (Jan. 1 to Nov. 20) | $1,180,627.50 all types; $1,377,500 houses only (MLS) |
| Homes sold since Jan. 2023 | 2,160 (MLS) |
| Biggest neighborhoods by sales since 2023 | South of Broad, Harleston Village, Wagener Terrace, North Central, Westside, Ansonborough |
| Public schools | Charleston County School District. Zoned high school: Burke High. Zoned middle school: Simmons-Pinckney Middle. Confirm the zone by address |
| Parks | White Point Garden and Waterfront Park on the lower peninsula; Hampton Park on the Upper Peninsula, with the Saturday farmers market in season |
| Drive times from Meeting St. and Broad St. | MUSC 7 to 9 min, Patriots Point 12 to 18 min, CHS airport 18 to 28 min, Folly Beach (pier) 20 to 28 min (Google Maps, typical for an 8 a.m. weekday start; see Commute) |
| Flood insurance | City of Charleston is FEMA CRS Class 6 (up to 20% off eligible NFIP policies). Flooding varies street by street; check the parcel |
| Property tax rate | 300.8 mills in City of Charleston-Downtown (District 71) and City of Charleston-Neck Area (District 72) (2026) |
| Short-term rentals | City residential short-term rentals have to be the owner's primary home, with a permit. On the peninsula, Category 1 and Category 2 rules apply (and a commercial overlay in part of Cannonborough-Elliotborough). Check the address on the city's map |

Downtown Charleston market report by year
Closed single-family detached and attached sales, all types together, in MLS areas 51 and 52. 2026 runs through November 20.
| Year | Homes sold | Median price | Avg $/sq ft | Median days on market | Avg sale-to-list | Sold over list | $750K+ share | $1M+ sales | Total volume |
|---|---|---|---|---|---|---|---|---|---|
| 2023 | 512 | $877,500 | $643 | 10 | 97.4% | 16% | 63% | 212 | $659M |
| 2024 | 529 | $1,049,000 | $701 | 18 | 96.4% | 12% | 73% | 274 | $766M |
| 2025 | 577 | $1,085,000 | $731 | 20 | 95.4% | 8% | 73% | 308 | $881M |
| 2026 YTD | 542 | $1,180,627.50 | $814 | 22 | 96.2% | 10% | 76% | 318 | $1,029M |
Source: CHS Regional MLS via Flexmls, closed single-family detached and attached sales. 2026 runs through Nov. 20.
Source: CHS Regional MLS via Flexmls, closed single-family detached and attached sales. 2026 runs through Nov. 20.
Source: CHS Regional MLS via Flexmls, closed single-family detached and attached sales. 2026 runs through Nov. 20.
Source: CHS Regional MLS via Flexmls, closed single-family detached and attached sales. 2026 runs through Nov. 20.
What I see in this: 2023 was still a sprint. The median home went under contract in 10 days, and 16% sold over asking. The median has climbed every year since, from $877,500 to $1,180,627.50, and average price per square foot is up from $643 to $814. This year's closed volume is already $1.029 billion, more than all of 2023. Days on market have settled in the low 20s, and the over-list share is down from 2023. Buyers are out there, especially at the top, but they compare. If you're selling, prep it and price it right and you'll do well. List it high to see what happens and you'll likely sit.
Houses vs. townhomes, 2026 YTD
| Type | Homes sold | Median price | Avg $/sq ft | Median days on market | Months of supply |
|---|---|---|---|---|---|
| Single-family detached | 362 | $1,377,500 | $807 | 19 | 3.4 |
| Single-family attached (townhomes, condos) | 180 | $900,000 | $828 | 24 | 4.9 |
Houses make up 67% of this year's sales, and they spend about three weeks on the market. Townhomes and condos take a little longer, and they are what pulls the all-types median down from $1,377,500 to $1,180,627.50. Attached homes actually sold for more per square foot this year ($828 vs. $807), which is the opposite of what you often see in the suburbs.
Inside vs. outside the Crosstown, 2026 YTD
| Area | Homes sold | Median, all types | Houses only | Attached median | Median days on market, houses | Months of supply |
|---|---|---|---|---|---|---|
| 51, inside the Crosstown | 372 | $1,375,000 | $2,363,000 (207 sales) | $950,000 (165 sales) | 22 | 4.2 |
| 52, outside the Crosstown | 170 | $940,000 | $994,990 (155 sales) | $510,000 (15 sales) | 12 | 3.2 |
This is the split that matters. Houses below the Crosstown are in a different price world than houses above it. The Upper Peninsula also has far fewer attached sales (15 so far this year, so that $510,000 median is a small sample). Houses there are moving in about 12 days, with only about 2.7 months of supply.

What your budget buys in Downtown Charleston
Source: CHS Regional MLS via Flexmls, closed single-family detached and attached sales. 2026 runs through Nov. 20.
2026 YTD closed sales by price band. "Typical" is the median for that band.
| Budget | Homes sold | Share | Typical size | Typical beds | Detached share | Typical year built | Where most of them sold |
|---|---|---|---|---|---|---|---|
| Under $400K | 34 | 6% | 814 sq ft | 2 | 41% | 1940 | Ashley House, North Central, University Place, Cannonborough-Elliotborough, Berkeley Court |
| $400K to $600K | 49 | 9% | 1,053 sq ft | 2 | 29% | 1948 | Ansonborough, Wagener Terrace, Westside, Bee Street Lofts, Eastside |
| $600K to $800K | 61 | 11% | 1,243 sq ft | 2 | 62% | 1930 | North Central, Wagener Terrace, Westside, Bee Street Lofts, Eastside |
| $800K to $1M | 80 | 15% | 1,426 sq ft | 3 | 66% | 1966 | North Central, Harleston Village, Westside, Wagener Terrace, Radcliffeborough |
| $1M to $1.5M | 109 | 20% | 1,719 sq ft | 3 | 70% | 1938 | Wagener Terrace, Harleston Village, North Central, South of Broad, George and Society, Elliotborough |
| $1.5M to $2.5M | 87 | 16% | 2,380 sq ft | 3 | 76% | 1929 | South of Broad, Harleston Village, Wagener Terrace, Radcliffeborough, Hampton Park Terrace, French Quarter |
| $2.5M+ | 122 | 23% | 3,438 sq ft | 4 | 83% | 1876 | South of Broad, Harleston Village, Ansonborough, French Quarter, One Vendue Range, Gadsdenboro |
Under $400K is a small slice this year (6%), a mix of older condominiums such as Ashley House and some smaller Upper Peninsula sales. $400K to $800K is where more of the Upper Peninsula shows up: North Central, the Westside, Eastside, plus attached homes in places like Bee Street Lofts and Ansonborough. $800K to $1.5M is the busiest stretch, and it mixes Wagener Terrace and North Central with Harleston Village and a few South of Broad attached sales. $1.5M+ clusters below the Crosstown, especially South of Broad and Harleston Village, with Hampton Park Terrace as the Upper Peninsula exception. The $2.5M+ band alone is 23% of this year's sales.
Downtown Charleston neighborhoods
Closed single-family sales by MLS subdivision name. "Since 2023" covers Jan. 1, 2023 to Nov. 20, 2026. Typical size and year built are medians. The inside vs. outside grouping follows the MLS area, except as noted. Neighborhoods with fewer than 15 sales since 2023 are left out of the tables.
Jan. 1, 2023 to Nov. 20, 2026. Navy is inside the Crosstown (MLS area 51). Sky blue is the Upper Peninsula (MLS area 52). The grouping follows the MLS area. Source: CHS Regional MLS via Flexmls.
Inside the Crosstown (MLS area 51)
This is the historic lower peninsula: South of Broad, the French Quarter, Harleston Village and the neighborhoods that run up toward the Crosstown. It is also where most of the attached inventory lives.
| Neighborhood | Sales since 2023 | Median since 2023 | Median $/sq ft | 2026 YTD sales | 2026 YTD median | Typical size | Typical year built |
|---|---|---|---|---|---|---|---|
| South of Broad | 320 | $2,822,500 | $1,039 | 99 | $3,295,000 | 2,914 sq ft | 1888 |
| Wraggborough | 27 | $1,655,000 | $748 | 6 | $2,087,500 | 2,215 sq ft | 1885 |
| French Quarter | 55 | $1,550,000 | $924 | 17 | $2,000,000 | 1,596 sq ft | 1900 |
| Ansonborough | 95 | $1,400,000 | $863 | 25 | $1,700,000 | 1,585 sq ft | 1849 |
| Harleston Village | 260 | $1,340,000 | $786 | 57 | $1,610,000 | 1,900 sq ft | 1905 |
| Cannonborough-Elliotborough | 73 | $1,225,000 | $800 | 13 | $970,000 | 1,600 sq ft | 1890 |
| Gadsdenboro | 45 | $1,190,000 | $896 | 10 | $1,300,000 | 1,271 sq ft | 2018 |
| Radcliffeborough | 79 | $1,000,000 | $630 | 22 | $997,500 | 1,608 sq ft | 1890 |
| Elliotborough | 54 | $950,000 | $673 | 9 | $1,250,000 | 1,532 sq ft | 1890 |
| Eastside | 73 | $815,000 | $510 | 18 | $800,000 | 1,600 sq ft | 1895 |
South of Broad is in a class by itself: 320 sales since 2023, a median of $2,822,500, and a 2026 YTD median of $3,295,000. All ten of the highest closed sales in this guide are here. Harleston Village is the volume leader after South of Broad, with 260 sales and a median of $1,340,000. In the French Quarter and Ansonborough, attached sales pull the all-types median down (only 9 of 55 French Quarter sales, and 40 of 95 in Ansonborough, were detached houses). Gadsdenboro is a newer attached community (typical year built 2018, no detached sales in this pull). Eastside is filed mostly in area 51 in the MLS (70 of 73 sales).
Outside the Crosstown (MLS area 52, the Upper Peninsula)
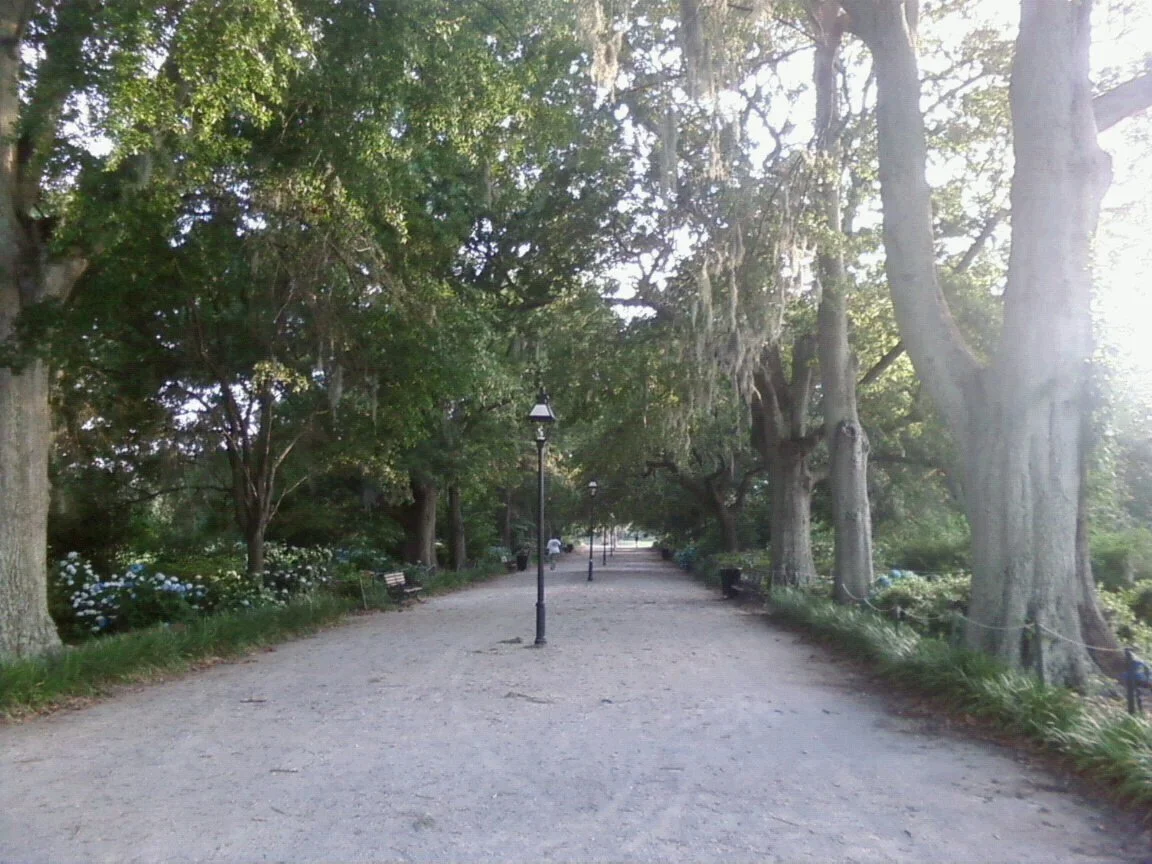
This is the part of the peninsula I called out in the $1M video: Wagener Terrace, Hampton Park, and the mid-century streets where a Saturday can start with coffee and a walk in the park, without touching the car keys.
| Neighborhood | Sales since 2023 | Median since 2023 | Median $/sq ft | 2026 YTD sales | 2026 YTD median | Typical size | Typical year built |
|---|---|---|---|---|---|---|---|
| Longborough | 15 | $1,750,000 | $682 | 3 | $2,250,000 | 3,052 sq ft | 2006 |
| Hampton Park Terrace | 45 | $1,594,000 | $647 | 14 | $1,613,500 | 2,554 sq ft | 1920 |
| Wagener Terrace | 186 | $942,500 | $571 | 48 | $1,157,500 | 1,685 sq ft | 1942 |
| Westside | 98 | $832,000 | $558 | 24 | $801,250 | 1,626 sq ft | 1935 |
| North Central | 160 | $799,999.50 | $553 | 43 | $865,000 | 1,484 sq ft | 1935 |
Wagener Terrace is the volume leader on the Upper Peninsula: 186 sales since 2023, a median of $942,500, and a typical house built around 1942. Houses only, that median is $1,025,000 (162 sales). Hampton Park Terrace sits higher, at $1,594,000, with larger houses (typical size 2,554 sq ft) from around 1920. North Central is the high-volume, more attainable end, with a median of $799,999.50. Longborough has only 15 sales (3 this year), so treat that median as a small sample.
Townhomes and condos
These are what pull the all-types median down, especially below the Crosstown. Almost all of them have an association listed in the MLS.
| Neighborhood | Sales since 2023 | Median since 2023 | Median $/sq ft | 2026 YTD sales | 2026 YTD median | Typical size | Typical year built |
|---|---|---|---|---|---|---|---|
| George and Society | 14 | $1,147,500 | $896 | 6 | $1,147,500 | 1,224 sq ft | 2007 |
| Fort Sumter House | 12 | $1,020,000 | $984 | 0 | n/a | 1,094 sq ft | 1950 |
| Morris Square | 19 | $912,500 | $570 | 4 | $1,056,250 | 1,699 sq ft | 2018 |
| Bee Street Lofts | 35 | $610,000 | $451 | 10 | $600,000 | 1,470 sq ft | 2007 |
| Dockside | 31 | $515,000 | $416 | 0 | n/a | 1,237 sq ft | 1978 |
| Ashley House | 31 | $300,000 | $309 | 5 | $215,000 | 1,053 sq ft | 1965 |
Fort Sumter House and Dockside had no closed sales in the 2026 YTD window of this pull. George and Society and Fort Sumter House are included despite having fewer than 15 sales because they sit at a different price point than the larger attached buildings.
Pockets I watch closely
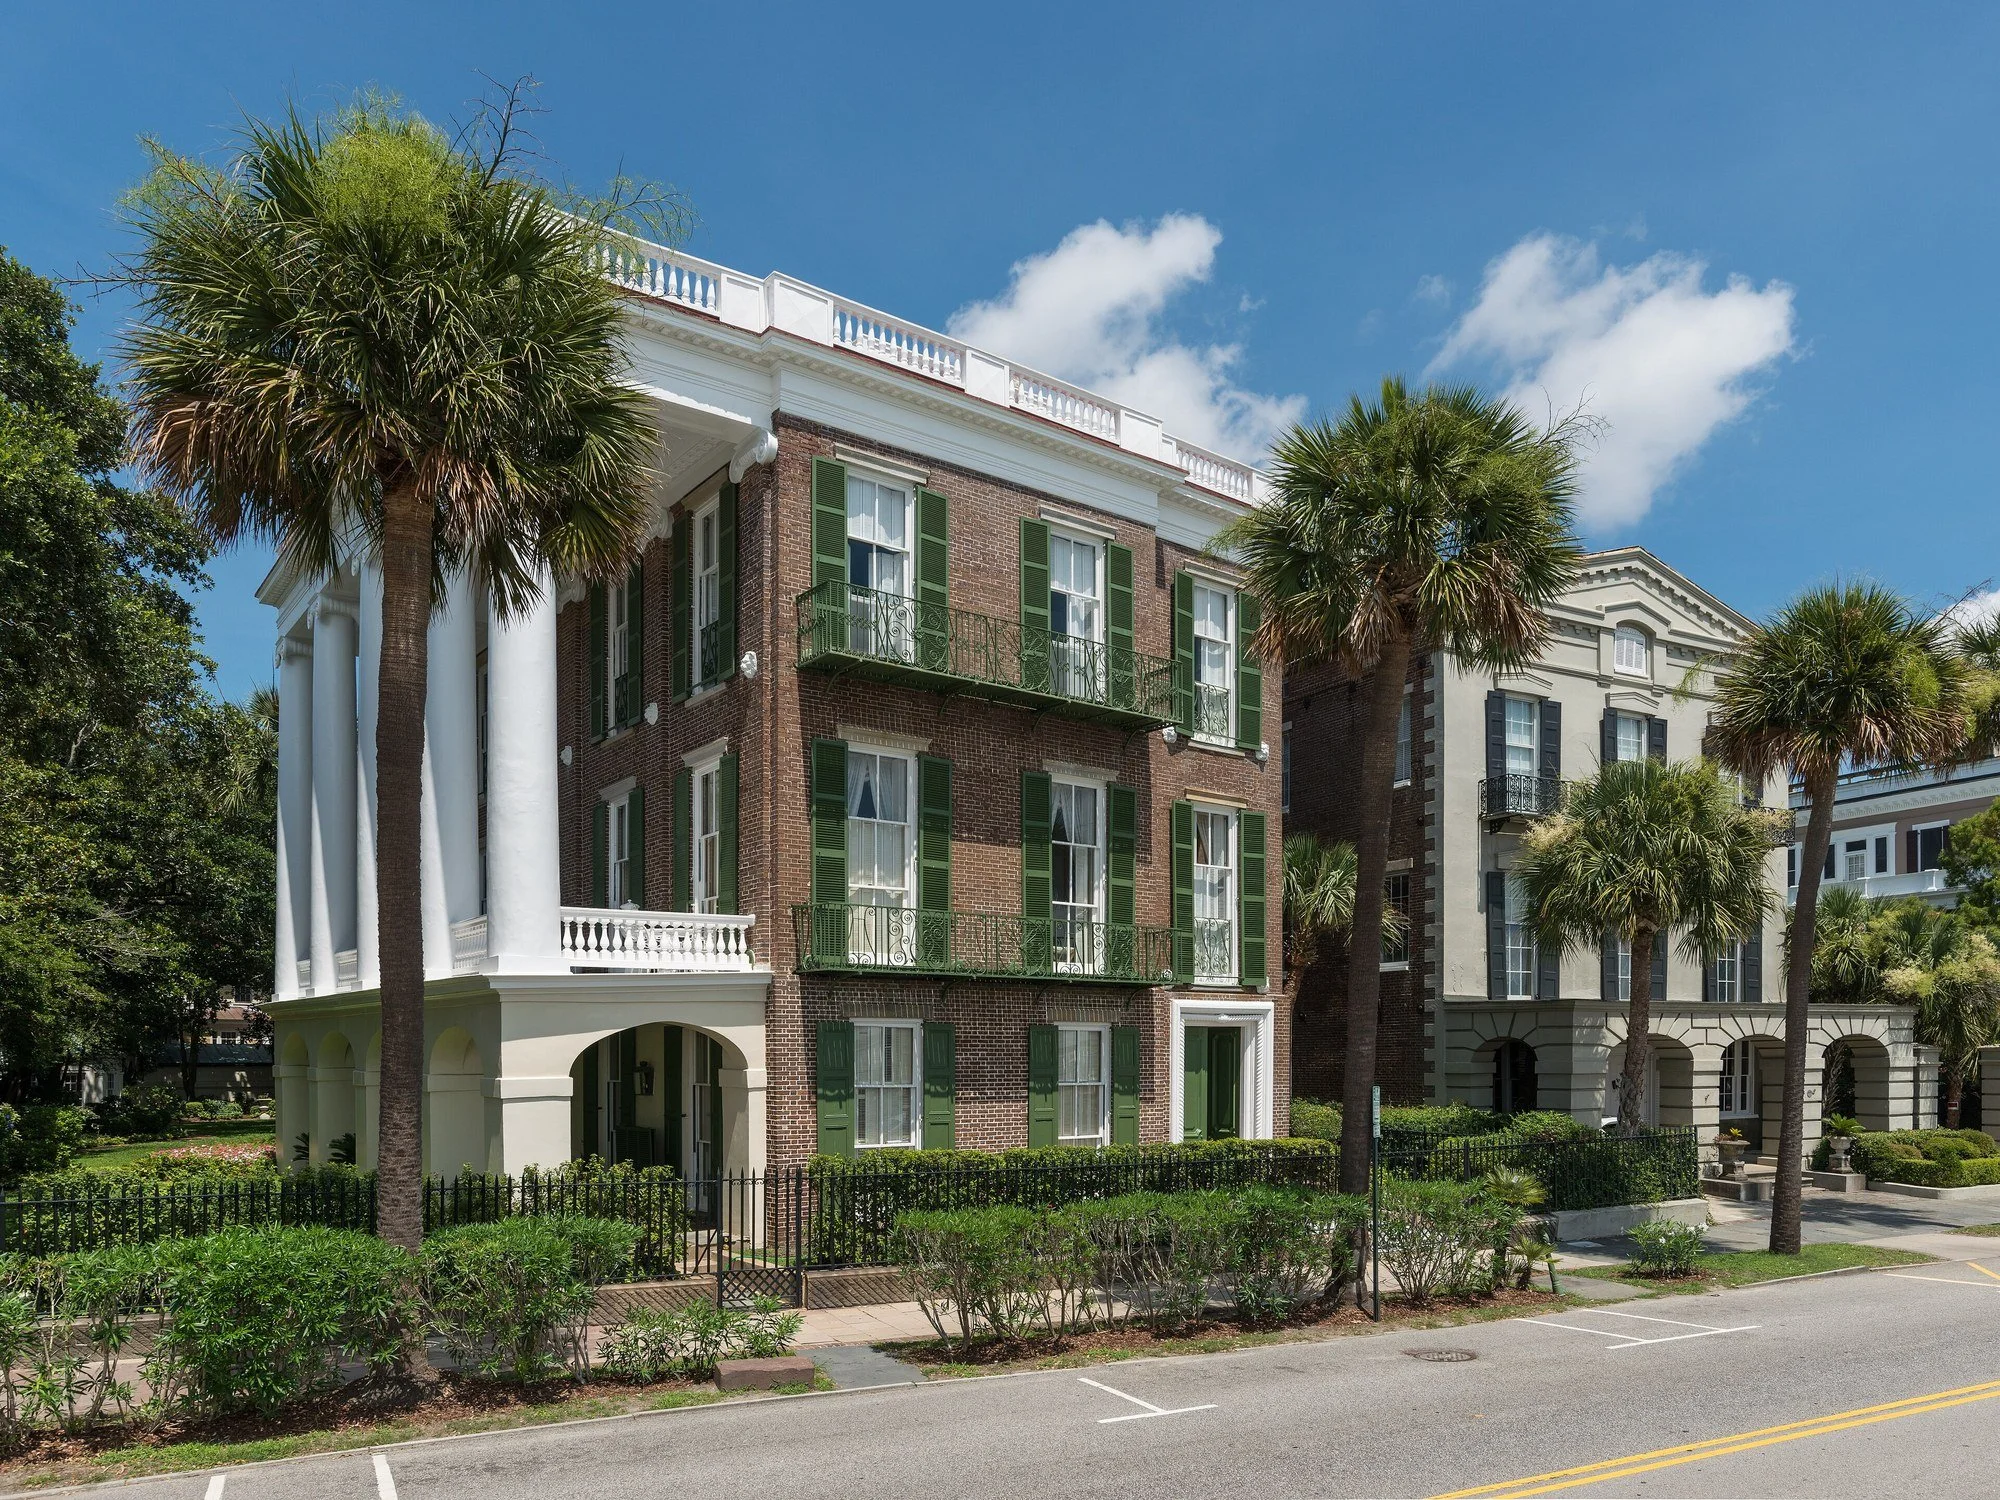
South of Broad is the luxury end of the peninsula: 320 sales since 2023, a median of $2,822,500, and every one of the ten highest closed sales in this guide. When I talked in the mid-year video about headline sales in the upper teens and lower $20 million, this is the street inventory behind it.
French Quarter is the pocket just north of Broad, generally between Meeting Street and the waterfront, up toward Market Street. The name is now used for that wider stretch of the old walled city; the 1973 National Register listing was a smaller block around Lodge Alley. Most sales here are attached homes, not detached houses: 46 of the 55 closed sales since 2023 were townhomes or condos, and the all-types median is $1,550,000. I am not hanging a houses-only median on 9 sales. It suits someone who wants to be close to Waterfront Park and the lower peninsula, and who is open to a condo or townhome.
Ansonborough sits just north of the City Market, in the box bounded by Market, Calhoun, Meeting, and East Bay Streets. It was Charleston's first suburb, and a lot of the houses you see today went up after the 1838 fire or were later restored. Since 2023 there have been 95 sales with an all-types median of $1,400,000, but that mixes two markets: 40 detached houses (median $3,419,000) and 55 attached homes (median $675,000). It suits someone who wants historic streets a short walk from the Market and East Bay, and who will look carefully at whether they're buying a house or an attached home.
Harleston Village is the other high-volume historic neighborhood, with 260 sales and a median of $1,340,000, and it mixes houses and attached homes on streets you can walk to the College of Charleston and the lower peninsula parks.
Radcliffeborough sits north of Calhoun, between King Street and Ashley Avenue, up to Morris Street (and Bee Street west of Rutledge), according to the neighborhood association. MUSC is on the west side, the College of Charleston and Marion Square are on the south, and Upper King is on the east. The housing is mostly older houses (54 of 79 sales since 2023 were detached) with a typical year built around 1890, and the all-types median is $1,000,000. It suits someone who wants to walk to the hospital, the College, or King Street, and who is fine with a busier mid-peninsula block.
Elliotborough (the city often spells it Elliottborough) is the east side of Cannonborough-Elliotborough, generally east of Rutledge Avenue, from Morris and Bee Streets up to the Crosstown and over toward King Street, based on the City of Charleston's 2009 area character appraisal. The two sides function as one neighborhood, with older houses, some newer infill, and a short walk to Upper King. The MLS splits the labels, so I am not hanging one median on the whole area. Sales filed as Elliotborough alone have a median of $950,000 since 2023 (54 sales). A larger group is filed as Cannonborough-Elliotborough (73 sales, median $1,225,000). It suits someone who wants to be close to Upper King and the Crosstown, and who will check the exact street and the name on the listing.
Wagener Terrace is where most of the Upper Peninsula's million-dollar houses land. The all-types median since 2023 is $942,500; houses only, it's $1,025,000, and the 2026 YTD median for the neighborhood is $1,157,500.
Hampton Park Terrace is the more expensive Upper Peninsula pocket next to the park: 45 sales, a median of $1,594,000, and the Saturday-in-the-park lifestyle I described in the video.
North Central and the Westside are the high-volume, more attainable Upper Peninsula streets, with medians of $799,999.50 and $832,000 since 2023.


Notable Downtown Charleston sales since 2023
The 10 highest closed sales in the MLS, Jan. 1, 2023 to Nov. 20, 2026, one line per address. All ten are in South of Broad.
| # | Address | Neighborhood | Sale price | Closed | Beds / Baths | Sq ft | Year built |
|---|---|---|---|---|---|---|---|
| 1 | 51 E Bay Street | South of Broad | $21,028,560 | Oct. 31, 2025 | 10 / 9 | 15,582 | 1799 |
| 2 | 5 East Battery | South of Broad | $18,250,000 | Feb. 28, 2025 | 11 / 12.5 | 10,504 | 1848 |
| 3 | 18 Murray Boulevard | South of Broad | $15,200,000 | April 7, 2025 | 5 / 5.5 | 8,138 | 1991 |
| 4 | 25 Legare Street | South of Broad | $14,272,000 | June 12, 2026 | 5 / 7 | 7,500 | 1840 |
| 5 | 9 E Battery | South of Broad | $13,300,000 | Nov. 17, 2026 | 8 / 7.5 | 11,355 | 1838 |
| 6 | 13 and 15 Meeting Street | South of Broad | $12,600,000 | April 11, 2023 | 13 / 10 | 11,426 | 1770 |
| 7 | 13 and 15 East Battery Street | South of Broad | $12,450,000 | Oct. 31, 2023 | 15 / 12 | 14,726 | 1845 |
| 8 | 172 Tradd Street | South of Broad | $10,000,000 | March 18, 2026 | 4 / 4.5 | 5,774 | 1834 |
| 9 | 43 Meeting Street | South of Broad | $9,950,000 | Feb. 17, 2026 | 5 / 5 | 5,788 | 1798 |
| 10 | 9 Tradd Street | South of Broad | $9,710,000 | June 12, 2024 | 6 / 6.5 | 6,568 | 2005 |
51 E Bay Street is the top closed sale in this pull, at $21,028,560. Five of the ten are at or above $13 million, and four have closed in 2026 already, including 9 E Battery on Nov. 17, 2026.
Living in Downtown Charleston
Below the Crosstown vs. the Upper Peninsula (my take)
I went through this in my video If I Had $1M in Charleston, I'd Move Here (the Downtown part starts at 12:39).
Video: If I Had $1M in Charleston, I'd Move Here (starts at the Downtown part, 12:39)
On the Upper Peninsula, the best part of a Saturday can be how little of it you have to plan. Coffee, a walk in Hampton Park, dinner and drinks on Upper King, the Saturday farmers market, and you never have to touch the car keys or cross a bridge. Some people even get around in a low-speed vehicle or golf cart. Check the rules first if that's part of your plan.
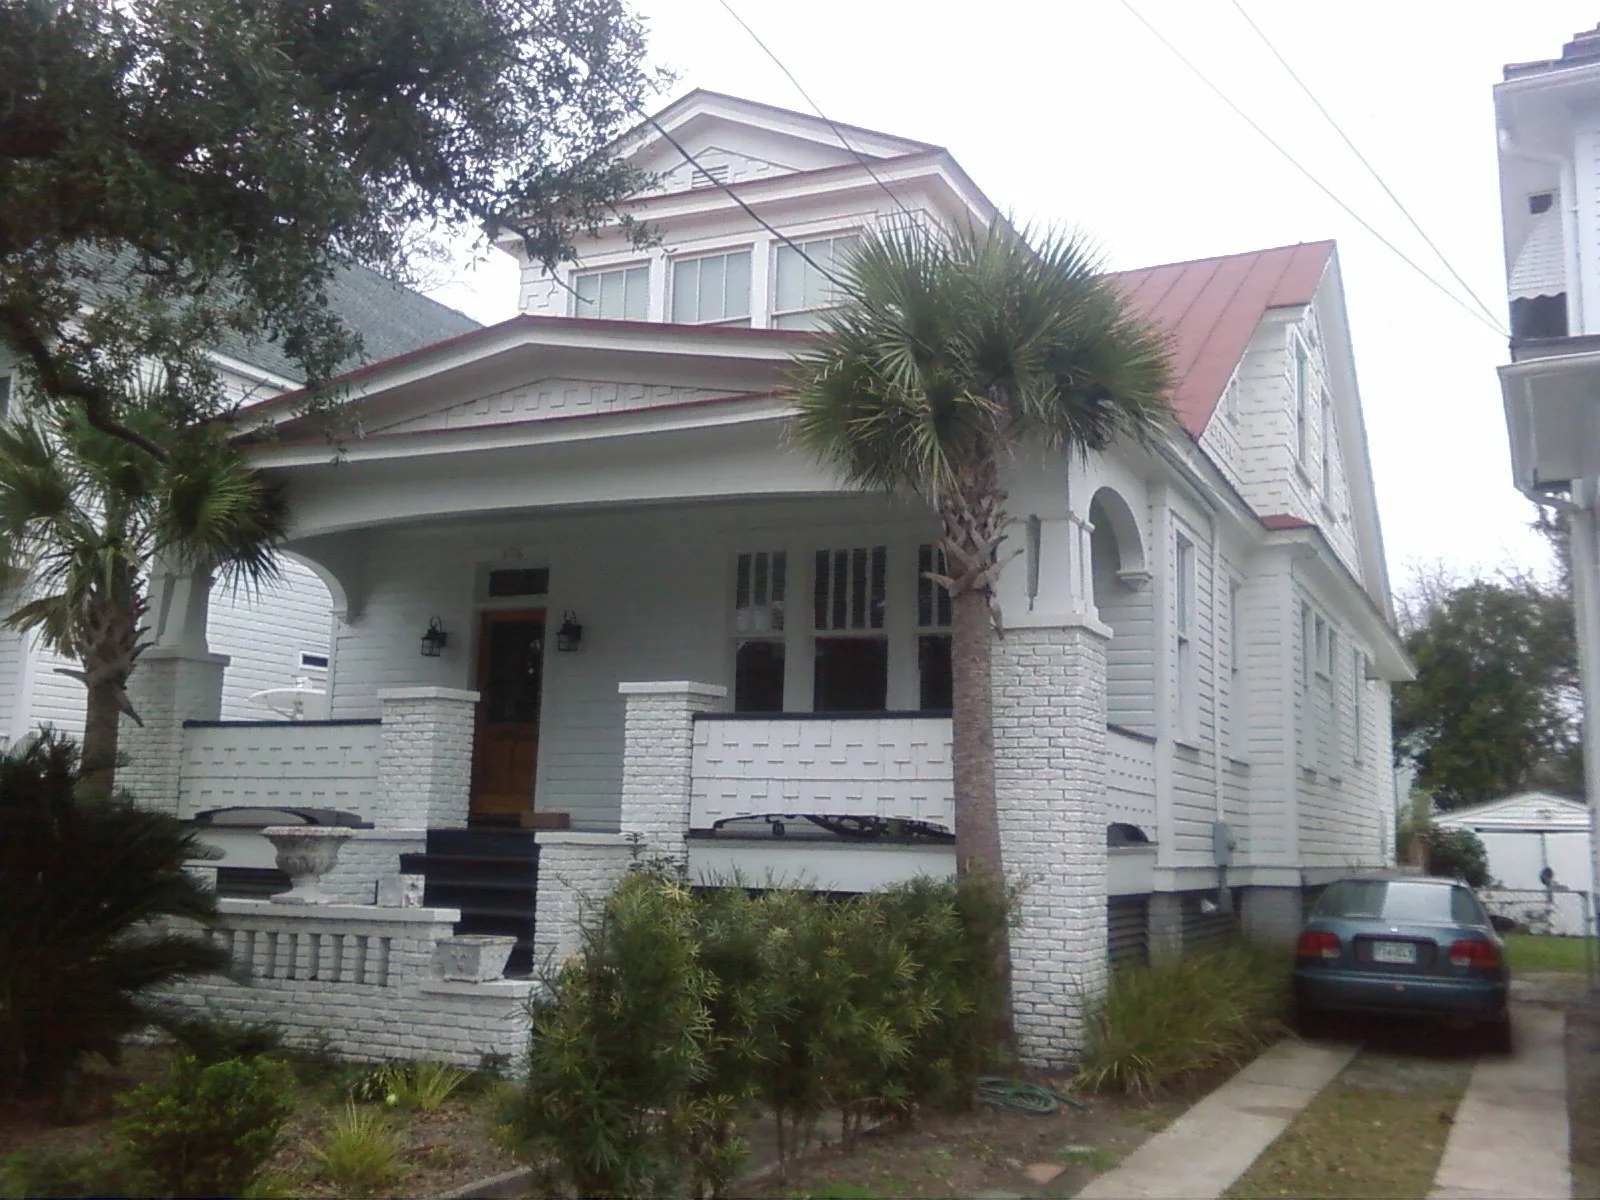
At a million dollars on this part of the peninsula, you're typically closer to an updated two-bedroom bungalow, or a three-bedroom that still needs a kitchen or bath update, than to a turnkey three-bedroom house. Those turnkey three-bedrooms climb over $1M easily. Most of these houses were built around World War II, with smaller footprints and smaller yards, and the bones are older. Wagener Terrace is where most of the million-dollar houses on the Upper Peninsula have been landing.
Below the Crosstown, the picture changes. Houses there sold closer to $2 million in 2025, so a $1M budget in the historic lower peninsula mostly means a condo or townhome, not a detached house.
The trade-offs are real. You get walkability and a short trip to almost everything on the peninsula. You also get less house, less yard, and flooding you have to take seriously. A lot of this land used to be marsh and creeks (I said about half of downtown in the video). Before you fall in love with a house, check whether the street floods before the house does. There's only one peninsula, and buyers keep lining up for it.
Parks and getting around
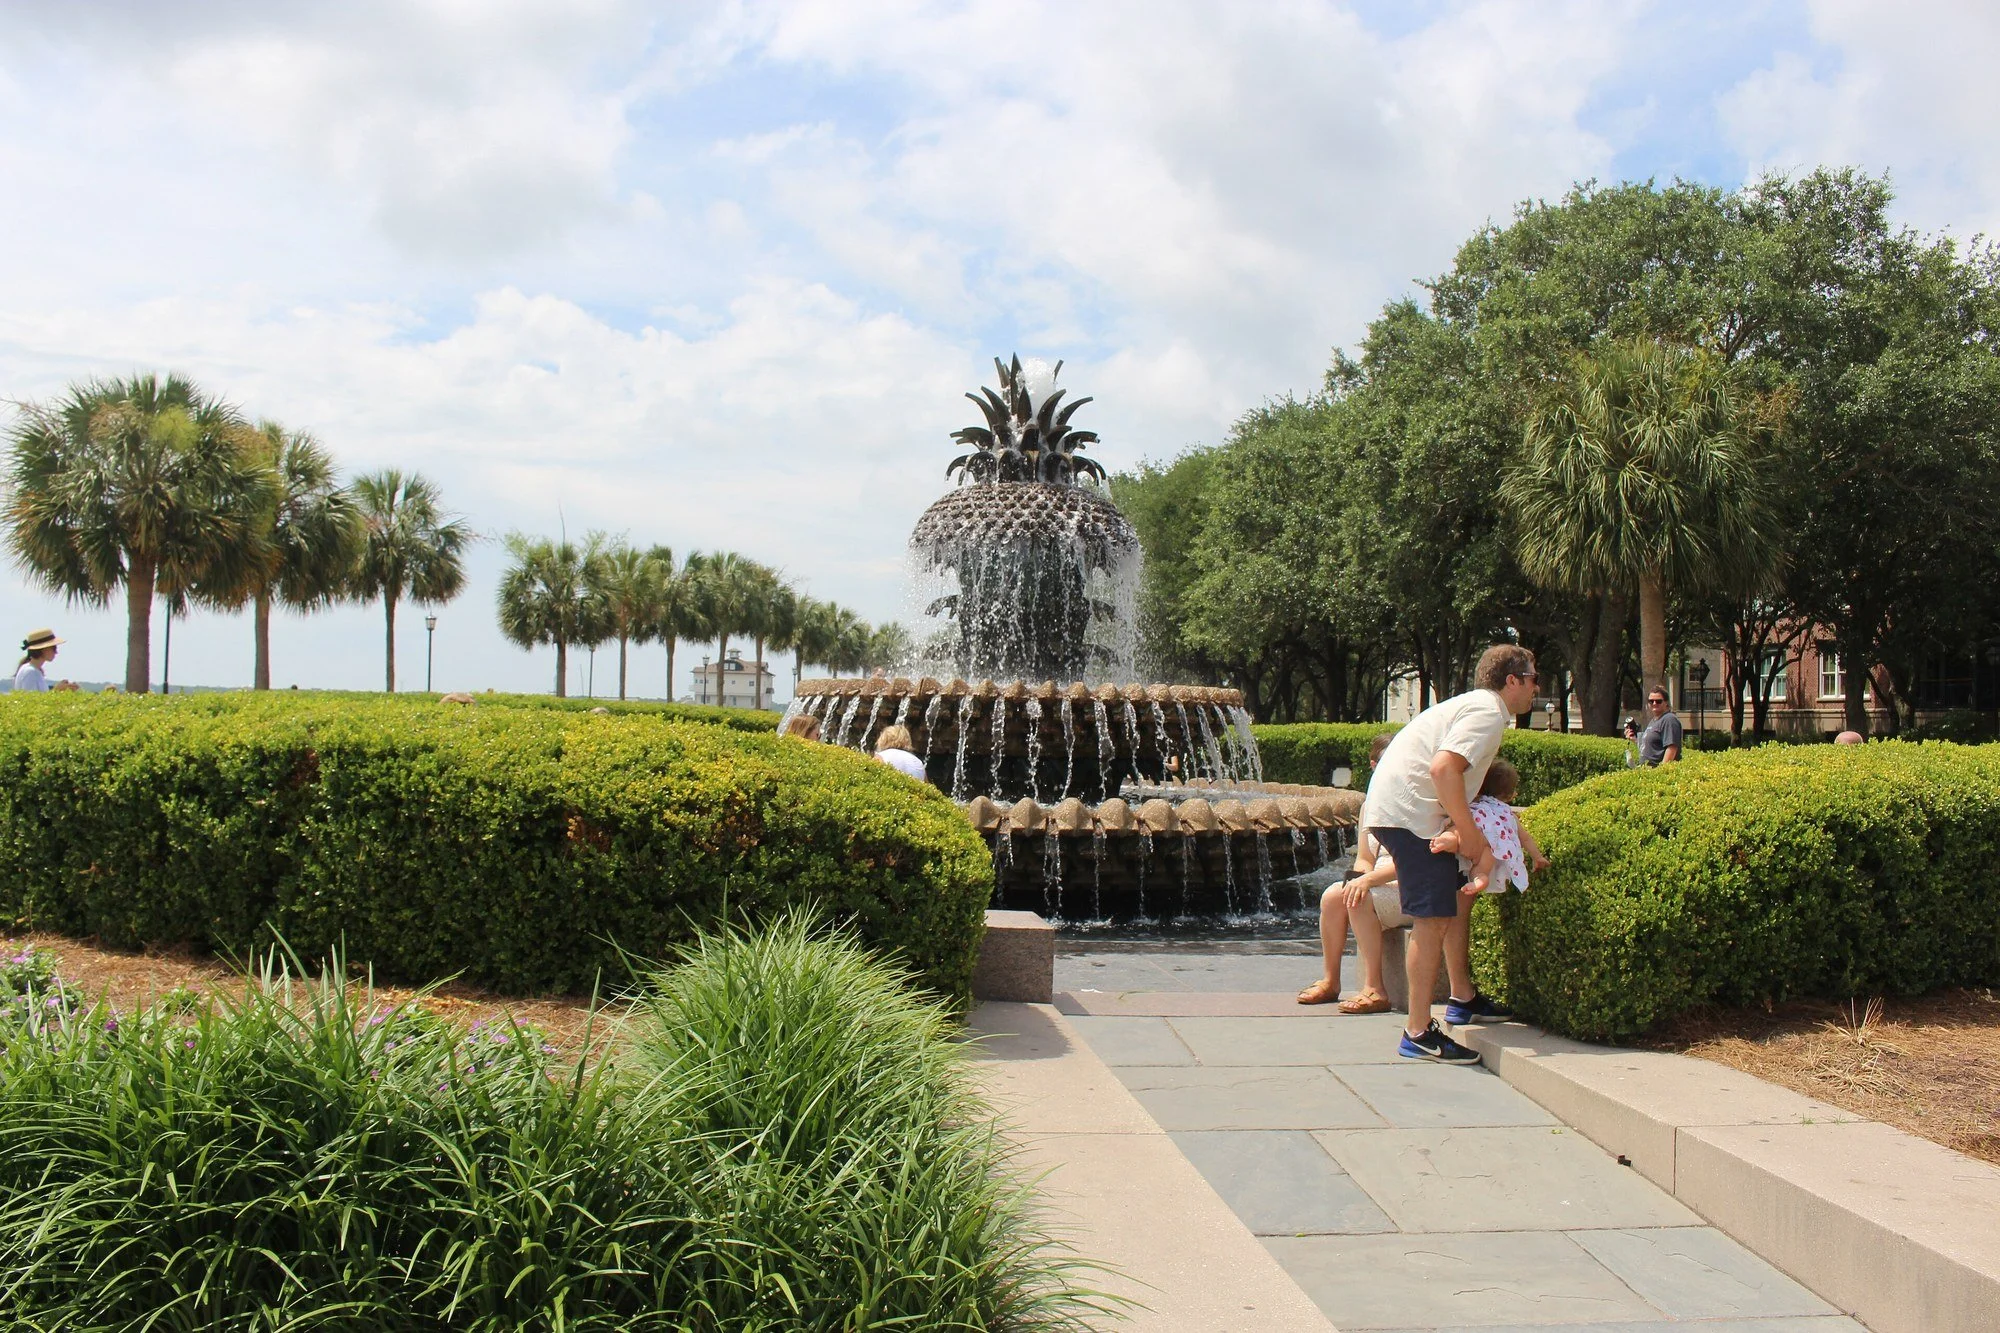
White Point Garden and the Battery, Waterfront Park, and Hampton Park are the outdoor anchors I come back to with clients. The lower peninsula is a walking city. The Upper Peninsula is too, once you're near the park and Upper King. Drive times are short when traffic cooperates (see Commute), but a parking plan still matters, and a summer weekend is a different trip than an 8 a.m. Tuesday.
Schools
Public schools on the peninsula are in the Charleston County School District. Zones are assigned by address, and they change, so confirm yours with the CCSD school locator. The ratings below are South Carolina Department of Education 2024-25 report cards, as compiled by Charleston News Today (updated Oct. 16, 2026). They describe schools, not people or neighborhoods.
The zoned high school for the peninsula is Burke High (Below Average, 47) at 244 President Street. The zoned middle school is Simmons-Pinckney Middle (Unsatisfactory, 26) at 2 Perry Street.
| School | Grades | 2024-25 rating |
|---|---|---|
| Burke High | 9 to 12 | Below Average (47) |
| Simmons-Pinckney Middle | 6 to 8 | Unsatisfactory (26) |
| Memminger Elementary | Pre-K to 5 | Average (45) |
| James Simons Montessori | zone and choice | Good (50) middle, Average (52) elementary |
| Sanders-Clyde Elementary | Pre-K to 5 | Good (57) |
James Simons Montessori is at 741 King Street. Sanders-Clyde Elementary is at 805 Morrison Drive. Memminger Elementary is at 20 Beaufain Street. Mitchell Elementary, which used to share the 2 Perry Street campus, no longer appears in the district directory or the 2026-27 bell schedule; that former zone has been assigned to James Simons and Sanders-Clyde, and Simmons-Pinckney now sits at that address.
Application, magnet and charter schools also serve the peninsula. They are not zoned upgrades. Seats are by application, and several have no attendance zone:
| School | Grades | 2024-25 rating | Notes |
|---|---|---|---|
| Buist Academy, 103 Calhoun St. | 3 to 8 | Excellent (78 middle, 77 elementary) | Apply only |
| Charleston Progressive Academy, 382 Meeting St. | Pre-K to 5 | Good (55) | Apply |
| Charleston Charter School for Math and Science, 1002 King St. | 6 to 12 | Excellent (73) high, Good (51) middle | No zone |
| Charleston Development Academy, 233 Line St. | Pre-K to 8 | Average (45) middle, Good (53) elementary | No zone |
Early College High School at 63 Columbus Street does not have a report card of its own in that compilation. Countywide magnets such as Academic Magnet, School of the Arts and Military Magnet are in North Charleston and take students by application.
Commute and getting off the peninsula
You do not need a bridge for most of daily life on the peninsula. The Crosstown (Septima Clark Parkway / U.S. 17) is the main east-west cut, and the Ravenel Bridge and the Ashley River bridges are how you leave.
Drive times leaving at 8 a.m. on a weekday. These are Google Maps' "typically" ranges, which are based on past traffic.
From the core of the lower peninsula (Meeting Street and Broad Street):
| Destination | Typical at 8 a.m. on a weekday | Distance |
|---|---|---|
| MUSC (171 Ashley Ave.) | 7 to 9 min | about 1.8 mi |
| Patriots Point, Mount Pleasant | 12 to 18 min | about 5.5 mi |
| CHS airport | 18 to 28 min | about 12.7 mi |
| Folly Beach (pier) | 20 to 28 min | about 11.6 mi |
Where you start on the peninsula makes a difference:
| Destination | From King St. and Spring St. (Crosstown / Upper King) | From Rutledge Ave. and Grove St. (Hampton Park / Wagener Terrace) |
|---|---|---|
| MUSC | 6 to 8 min, about 1.1 mi | 6 to 14 min, about 1.6 mi |
| CHS airport | 14 to 20 min, about 11.4 mi | 12 to 18 min, about 10.2 mi |
| Folly Beach (pier) | 22 to 35 min, about 11.4 mi | 22 to 40 min, about 11.7 mi |
An 8 a.m. Tuesday drive time will not show you a holiday weekend on the Ravenel Bridge or a summer Saturday toward Folly. Drive the trip you actually care about before you buy.
Flood zones and elevation
The City of Charleston is in the FEMA Community Rating System as Class 6, which can mean up to 20% off eligible NFIP policies. That is a community-wide discount, not a promise about a particular street.
Flooding on the peninsula is not one-size-fits-all. Some streets take on water in a heavy rain or a king tide, and some houses sit higher than the pavement in front of them. As I said in the video, a lot of this land used to be marsh and creeks, and you should check whether the street floods before the house does. Ask for an elevation certificate, look at the city's flood resources, and walk the block after a rain. The city's flood guidance is that all properties in the City of Charleston are in a flood zone, but not all are in the Special Flood Hazard Area.
HOAs
The MLS records whether a sale listed an association (AssociationYN), not the dollar amount of the dues, so I am not inventing fees here. Since 2023, about 35% of closed sales on the peninsula listed an association: about 41% in area 51 and about 22% in area 52. Many historic streets have no association in the MLS. Condo and newer attached buildings almost always do. Confirm the covenants, any historic-district rules, and the actual fee before you write an offer.

Taxes and rules
South Carolina property tax: 4% vs. 6%
South Carolina taxes homes on an assessed value, which is a percentage of market value.
- 4% applies to your legal residence (primary home), on up to 5 acres. You have to apply for it with the Charleston County Assessor. It is not automatic.
- 6% applies to second homes, rentals and other non-primary homes.
- When a home sells, it's reassessed to market value. The 15% cap on reassessment increases does not apply to that sale.
- Your legal residence also gets Property Tax Relief: it doesn't pay the school operating millage (145.2 mills in 2026), per the Charleston County Auditor.
That 4% vs. 6% gap is big. File for the 4% rate as soon as you close.
City millage on the peninsula (2026, Charleston County)
The peninsula is inside the City of Charleston. Two tax districts show up in the Auditor's 2026 millage card, and both currently carry the same total rate. Your tax bill or the county's records will show which one applies to the parcel.
| Tax district | Total millage |
|---|---|
| City of Charleston-Downtown (District 71) | 300.8 |
| City of Charleston-Neck Area (District 72) | 300.8 |
The city rate is 218.8 countywide (schools, county, parks and Trident Tech) plus 82.0 for the city. Homes in the city also get a county tax credit and a city tax credit, both figured from the home's value.
Rough example, not a tax bill: for a $500,000 home, the Charleston County tax estimator (2026 rates) comes to about $2,401 a year at the 4% legal-residence rate and about $8,313 a year at the 6% rate, in both District 71 and District 72. Those totals include the credits and the $154 solid-waste user fee, with stormwater set to 0 in the estimator. Run the address, because exemptions, assessments and fees can change the number.
Short-term rentals
The peninsula is not in the city's Category 3 rules that cover West Ashley, James Island and the rest of the city off the peninsula. Residential short-term rentals still have to be the owner's full-time primary residence, verified by the county's 4% legal residence rate. Investment properties don't qualify, except for commercially zoned properties in the Short Term Rental Overlay (part of Cannonborough-Elliotborough).
On the peninsula, check the address on the city's category map:
- Category 1 is the Old and Historic District. The short-term rental has to be in an existing structure or accessory building that is individually listed on the National Register of Historic Places. One short-term rental unit per property, plus one extra off-street parking space on top of what the home already needs.
- Category 2 is the rest of the peninsula outside the Old and Historic District and the Short Term Rental Overlay. The building has to be at least 50 years old. Same one-unit and extra-parking rules.
- The Short Term Rental Overlay (part of Cannonborough-Elliotborough) is the exception for commercial short-term rentals in certain commercial zoning districts, with its own cap and parking rules.
You need a city short-term rental permit and a business license, renewed every year. City Council gave first reading on Nov. 17, 2026 to changes to the short-term rental ordinance, including guest limits. It isn't final, so check the current rules before you plan on rental income. Monthly (30-day and longer) rentals are a different set of rules. HOA covenants and historic-district rules still apply. Check the parcel.
Flood insurance
City of Charleston is FEMA CRS Class 6, which can mean up to 20% off eligible NFIP policies. That discount depends on the policy and the zone, and it is not a substitute for looking at the actual flood risk of the street and the finished-floor elevation. Ask for an elevation certificate and confirm the zone on the parcel before you budget insurance.
Downtown Charleston FAQs
What's the median home price in Downtown Charleston?
For 2026 so far (January 1 to November 20), the median closed price for single-family detached and attached homes in MLS areas 51 and 52 is $1,180,627.50. Houses only, it's $1,377,500. Attached homes, it's $900,000. Those are CHS Regional MLS figures via Flexmls, not a listing portal.
Why did your mid-year video say the Downtown median was $2.55 million?
That was a different slice of this market, and it matches this pull once you line up the geography, the home type and the dates. The $2.55 million (and the 45.5% jump) in my July 2026 mid-year video is the year-to-date median for houses only, inside the Crosstown (MLS area 51), from January through June 2026. In this Flexmls pull, that same slice is $2,550,000 (137 sales), up 45.5% from $1,752,500 in January through June 2025 (102 sales). The June median in that same houses-only, area-51 slice is $2,640,000 (31 sales), versus $1,150,000 in June 2025 (14 sales), which is the $2.64 million vs. $1.15 million I cited from the Charleston Trident Association of REALTORS® Local Market Update.
This guide's $1,180,627.50 covers all home types in areas 51 and 52 from January 1 to November 20, 2026. For houses only inside the Crosstown over that longer stretch, the median is $2,363,000 (207 sales). The mid-year number ran hotter; more sales closed after June and pulled that slice down. Neither figure is wrong. They answer different questions.
You said Upper Peninsula sales run in the high 800s, and houses below the Crosstown were closer to $2 million in 2025. Do the sales back that up?
Yes, with the same caveats I used in the video. In calendar year 2025, the all-types median in area 52 (the Upper Peninsula) was $892,500 (182 sales). Houses only, it was $965,000 (154 sales). That is the "high 800s, and that includes condos and townhomes; single-family houses sit a bit higher" line. So far in 2026, the area-52 all-types median is $940,000, and houses only are $994,990.
For houses inside the Crosstown, the 2025 calendar-year median was $1,940,000 (196 sales). That is the "closer to $2 million in 2025" line. So far in 2026, that same houses-only, area-51 median is $2,363,000.
Are Downtown home prices still going up?
Yes, in this pull. The all-types median is up from $1,048,673.50 in the same Jan. 1 to Nov. 20 window of 2025 to $1,180,627.50 so far in 2026. Houses only: $1,280,000 then, $1,377,500 now. Average price per square foot is up from $730 in that 2025 window to $814. Sales and dollar volume are up too. That does not mean every neighborhood moved the same amount, and it does not mean a particular house is worth 13% more than last year.
Is it a buyer's or seller's market?
It depends which end of the peninsula and which type of home. Across areas 51 and 52 there are about 3.9 months of supply (198 active listings on Nov. 20, 2026, against about 51 sales a month over the last 12 months). Houses are tighter, at about 3.4 months, and houses outside the Crosstown are tighter still, at about 2.7 months. Attached homes are closer to 4.9 months. Median days on market are 22 so far in 2026, versus 10 in 2023, and only about 10% of sales have gone over list. Sellers still have a hand, especially for well-prepared houses on the Upper Peninsula, but this is not 2023.
Inside the Crosstown or the Upper Peninsula?
If you want the historic lower peninsula, walkability to the Battery and Waterfront Park, and you're shopping for a detached house, area 51 is a much higher price point (houses only, $2,363,000 so far in 2026). If you want more house for the money, mid-century streets, and Saturday at Hampton Park, area 52 is where most of those sales are, with a houses-only median of $994,990 so far this year. Attached homes exist in both, but most of them are below the Crosstown. I wouldn't pick a side from a median. Walk both, at the hours you'd actually live there.
Which high school will my kids go to?
The zoned public high school on the peninsula is Burke High. Zones are assigned by address and they change, so confirm yours with the CCSD school locator. Application and magnet programs (Buist Academy, Charleston Charter School for Math and Science, and the countywide magnets in North Charleston) are a separate process, not a zoned assignment.
Can I buy a home downtown and rent it on Airbnb?
Usually not as a pure investment. A residential short-term rental in the City of Charleston has to be your full-time primary home (the 4% legal residence rate). On the peninsula, Category 1 (Old and Historic District, and the building has to be individually listed on the National Register) and Category 2 (elsewhere on the peninsula outside the overlay, and the building has to be at least 50 years old) also apply. There is a commercial overlay in part of Cannonborough-Elliotborough with different rules. You need a city permit and a business license, and City Council gave first reading on Nov. 17, 2026 to ordinance changes that are not final yet. Check the address on the city's map, and check any HOA or historic-district rules, before you count on rental income.
How much are property taxes?
It depends on the 4% vs. 6% rate, the assessed value after a sale, and the tax district. Districts 71 (Downtown) and 72 (Neck Area) both have a 2026 total millage of 300.8. For a $500,000 example in the Charleston County tax estimator, that's about $2,401 a year at 4% and about $8,313 a year at 6%, including credits and the $154 user fee. That's an example, not your bill. Run the address in the county tax estimator, and file for the 4% legal-residence rate if the home will be your primary residence.
Do I need flood insurance?
If the home is in a Special Flood Hazard Area and you're financing it, your lender will require it. Even outside the SFHA, flooding on the peninsula is street-specific, and the city notes that all properties in the City of Charleston are in a flood zone. The city's CRS Class 6 rating can mean up to 20% off eligible NFIP policies. Get the elevation certificate, look at the street after a rain, and budget for a policy unless you've confirmed you don't need one.
Watch more
- If I Had $1M in Charleston, I'd Move Here (Downtown at 12:39)
- Charleston Real Estate Mid-Year 2026: Downtown Charleston Spotlight (starts at 4:39)
Sources
- CHS Regional MLS via Flexmls: closed single-family detached and attached sales in MLS area 51 (Peninsula Charleston Inside of Crosstown) and area 52 (Peninsula Charleston Outside of Crosstown), Jan. 1, 2023 to Nov. 20, 2026, and active listings on Nov. 20, 2026. Pulled Nov. 20, 2026.
- Charleston County Auditor, 2026 millage card: https://www.charlestoncounty.gov/departments/auditor/files/archived/2026-millage-card.pdf (checked Nov. 20, 2026)
- Charleston County Auditor, tax estimator (2026 rates): https://www.charlestoncounty.gov/departments/auditor/taxestimator.php (checked Nov. 20, 2026)
- SC Department of Revenue, Property Tax Policy Manual, Chapter 5: https://www.dor.sc.gov/sites/dor/files/Documents/Policy%20Manuals/SCTIED-2025-Chapter%205.pdf (checked Nov. 20, 2026)
- City of Charleston, Short Term Rental Categories: https://www.charleston-sc.gov/2323/Category-Criteria (checked Nov. 20, 2026)
- City of Charleston, Short Term Rental Category Map: https://www.charleston-sc.gov/2310/Short-Term-Rental-Category-Map (checked Nov. 20, 2026)
- City of Charleston, short-term rental FAQ: https://www.charleston-sc.gov/DocumentCenter/View/18317/FAQs-for-STR (checked Nov. 20, 2026)
- Charleston City Council, Nov. 17, 2026 meeting (short-term rental ordinance, first reading)
- City of Charleston, flood information: https://www.charleston-sc.gov/ (city flood FAQs, checked against the West Ashley and James Island builds, Nov. 20, 2026)
- FEMA Community Rating System, City of Charleston Class 6
- South Carolina Department of Education 2024-25 report cards, as compiled by Charleston News Today (updated Oct. 16, 2026): https://charlestonnewstoday.com/public-schools/
- Charleston County School District school locator: https://www.ccsdschools.com/
- Google Maps drive-time "typically" ranges, departing 8:00 a.m. Tuesday, Nov. 24, 2026, from Meeting and Broad, King and Spring, and Rutledge and Grove
- Gentry Todd, "If I Had $1M in Charleston, I'd Move Here," Nov. 19, 2026, Downtown chapter 12:39 to 14:37: https://youtu.be/Z-Zl87uJL9o?t=759
- Gentry Todd, "Charleston Real Estate Mid-Year 2026 | Every Submarket Ranked," July 13, 2026, Downtown Charleston Spotlight 4:39 to 6:17: https://youtu.be/T6um6Bm8NMo?t=279. Mid-year dollar figures in that chapter were drawn from the Charleston Trident Association of REALTORS® Local Market Update (May and June 2026 reports) © ShowingTime Plus, and they match this Flexmls pull for houses only in area 51 through June 2026.
- Historic Charleston Foundation, Ansonborough Rehabilitation Project (neighborhood bounded by Market, Calhoun, East Bay, and Meeting Streets): https://scmemory.org/collection/ansonborough-rehabilitation-project/
- Charleston County Public Library, Nic Butler, "Inventing the French Quarter in 1973" (Sept. 15, 2023): https://www.ccpl.org/charleston-time-machine/inventing-the-french-quarter-in-1973
- National Register of Historic Places, Charleston's French Quarter District (listed Sept. 19, 1973; Lodge Alley, Cumberland, East Bay, and State Streets): https://schpr.sc.gov/index.php/Detail/properties/S10817710060
- Radcliffeborough Neighborhood Association, neighborhood boundaries: https://www.radcliffeboroughsc.org/about
- City of Charleston, Cannonborough-Elliottborough Area Character Appraisal (August 2009): https://www.charleston-sc.gov/DocumentCenter/View/1639/Cannonborough-Elliottborough-Area-Character-Appraisal
Photo credits: Wikimedia Commons images are used under the licenses shown in each caption (CC0, CC BY, CC BY-SA, or public domain).

Thinking about Downtown Charleston?
Whether you're weighing South of Broad against Wagener Terrace, trying to figure out what your budget really buys on the peninsula, or thinking about selling, I'm happy to walk through it with you. No pressure.
Set up a consultGentry Todd · The Gentry Todd Group at Compass · 843.730.4454